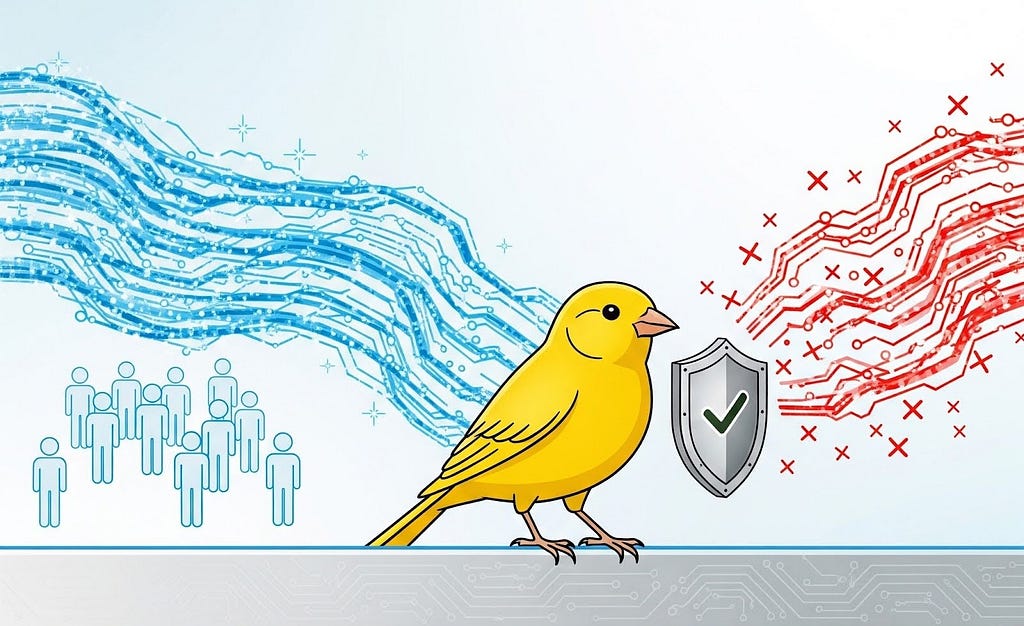
Step-by-Step Study Guide
Step 1: Understanding the Problem — Why Data Can Break Production
The Core Insight
Most engineering teams focus on validating code changes, but production systems can break from data changes alone.
The Netflix Incident
What changed?    → Nothing in code
What broke?      → A manual data fix corrupted a metadata feed
Impact?          → Millions of users lost playback ability
Detection time?  → Too slow — required intense manual triaging
Key Mental Model
Think of your system as having two deployment types:
| Deployment Type | Traditional Attention | Should Be |
|---|---|---|
| Code changes | ✅ Heavily validated | ✅ Heavily validated |
| Data changes | ❌ Often overlooked | ✅ Equally validated |
Why Data Corruption Is Especially Dangerous
- It can happen without any code change
- It can come from manual interventions or upstream sources
- Individual source validation does not guarantee the final output is correct
- Impact is immediate and widespread
💡 Key Takeaway: Just because something isn't a binary/executable doesn't mean it can't break production.
Step 2: Understanding the Unique Challenges
Before building a solution, Netflix identified four specific constraints that made this problem hard.
Challenge 1: Time Constraints
Traditional canary analysis:  30–60 minutes
Available window:             < 10 minutes
Standard tools were simply too slow for a continuously publishing data pipeline.
Challenge 2: Emergent Issues
Source A validation ✅
Source B validation ✅
Source C validation ✅
         ↓
Final transformed output ❌  ← Problems appear HERE
Bugs only appear after transformation, not in individual inputs. You must validate the final output, not just the inputs.
Challenge 3: Shadow Traffic Is Insufficient
| Traffic Type | What It Can Test |
|---|---|
| Shadow traffic | Replays requests to one service |
| Real production traffic | Tests the entire playback lifecycle across all services |
To detect real customer impact, you need real customer traffic.
Challenge 4: Limiting Blast Radius
Using real production traffic creates a paradox:
- You need real traffic to detect real problems
- But you can't let real customers experience those problems at scale
💡 Key Takeaway: Good system design means clearly defining your constraints before choosing a solution.
Step 3: The Architecture — How the Data Canary Works
The Three-Cluster Design
                    ┌─────────────────────┐
                    │    ORCHESTRATOR      │
                    │  (Coordinates flow)  │
                    └──────────┬──────────┘
                               │
              ┌────────────────┴────────────────┐
              ▼                                 ▼
    ┌──────────────────┐             ┌──────────────────┐
    │  BASELINE CLUSTER │             │  CANARY CLUSTER  │
    │  (Current prod   │             │  (New data       │
    │   data version)  │             │   version)       │
    └──────────────────┘             └──────────────────┘
              │                                 │
              └────────────────┬────────────────┘
                               ▼
                    ┌─────────────────────┐
                    │   CHAOS EXPERIMENT  │
                    │  Compare behavior   │
                    │  between clusters   │
                    └─────────────────────┘
                               │
                    ┌──────────┴──────────┐
                    ▼                     ▼
              ✅ PASS                  ❌ FAIL
         Publish new data          Block publication
What Each Component Does
Orchestrator Instance
- Acts as the coordinator/brain
- Verifies both clusters are healthy and synchronized
- Triggers the chaos experiment
- Reports results back to the transformer service
Baseline Cluster
- Always runs the current production data version
- Serves as the control group for comparison
Canary Cluster
- Receives the new data version being validated
- Serves as the experimental group
Generic Integration Point
- Results are reported via a simple REST endpoint
- This means other teams can adopt this pattern without changing core transformer code
💡 Key Takeaway: Separating baseline and canary into dedicated clusters prevents self-testing and cross-contamination.
Step 4: Meeting the 10-Minute Constraint — Engineering Decisions
Decision 1: Custom Threshold Tuning
Standard chaos experiment thresholds were too conservative (designed for longer windows). Netflix worked with their Resilience team to tune thresholds specifically for this use case.
Decision 2: Multi-Tenant Testing Strategy
Netflix discovered through experimentation that not all traffic is equal:
Client Type A traffic  →  Detects failures slowly
Client Type B traffic  →  Detects failures slowly
Playback request traffic → Detects failures FASTEST ✅
Lesson: Test with the traffic type most sensitive to the failure you're trying to catch.
Decision 3: Sticky Canaries (Session Affinity)
Without sticky canaries:
User → sometimes hits baseline, sometimes hits canary → Contaminated results ❌

With sticky canaries:
User → assigned to ONE cluster → stays there for entire experiment ✅
This ensures a clean apples-to-apples comparison.
Decision 4: Behavioral Metrics Over Technical Metrics
| Metric Type | Example | Problem |
|---|---|---|
| Technical | Latency, error rates | Data errors may not cause application errors |
| Behavioral | Starts Per Second (SPS) | Directly measures if customers can actually play content ✅ |
SPS (Starts Per Second) = actual playback attempts = direct measure of customer impact
Decision 5: Immediate Abort on Regression
Traditional approach:  Collect data → Analyze → Decide (slow)
Netflix approach:      Stream metrics in real-time → Abort IMMEDIATELY on regression (fast)
This trades some statistical confidence for speed — acceptable because thresholds are tight and the signal is clear.
💡 Key Takeaway: Every design decision was driven by the 10-minute constraint. Speed required trading traditional statistical rigor for real-time signal detection.
Step 5: Operational Reliability — The Devil in the Details
A system that runs every 10 minutes in production must handle edge cases that rarely matter in slower systems.
Problem 1: In-Flight Experiments During Redeployment
Scenario: Orchestrator restarts mid-experiment
Risk:     Validation cycle abandoned, bad data could slip through
Solution: Orchestrator detects ongoing experiments on startup and continues polling
Problem 2: Leader Election
Scenario: Multiple orchestrator instances running during deployment
Risk:     Same version triggers multiple experiments simultaneously
Solution: Safeguards ensure only ONE experiment per version announcement
Problem 3: Version Synchronization
Scenario: Different clients consume data at different speeds
Risk:     Baseline and canary clusters on different versions → invalid comparison
Solution: Track version state explicitly before triggering any experiment
💡 Key Takeaway: High-frequency automated systems require explicit handling of concurrency, restarts, and synchronization edge cases.
Step 6: Validation — Proving the System Works
How Netflix Tested Their Testing System
They deliberately broke things on purpose:
- Denylisted high-profile titles
- Simulated real data corruption scenarios
- Ran as coordinated proactive incidents during business hours
- Had product operations teams on standby
Traffic Volume
~0.2% of global traffic routed through validation
→ Enough signal to detect failures
→ Small enough to limit customer impact
Results
- Confirmed detection within the 10-minute window
- Revealed that different client types detect failures at different speeds
- Proved that threshold tuning is critical based on the magnitude of impact you want to catch
Step 7: The Broader Principle — Applying This to Any System
The Universal Questions to Ask
If you work with frequently changing data that impacts customers, ask:
- Do I validate my final output, or only my individual inputs?
- How long does it take to detect a data corruption issue today?
- Can I use real production traffic for validation while limiting blast radius?
- What metric most directly measures customer impact in my system?
- What happens if my validation system itself fails mid-cycle?
The Pattern Is Generalizable
High-velocity data pipeline pattern:
─────────────────────────────────────
Input Sources → Transform → [VALIDATE HERE] → Distribute to customers
                                ↑
                    Data Canary lives here
                    (baseline vs. canary cluster comparison
                     using real production traffic)
Summary: Core Concepts at a Glance
| Concept | Key Point |
|---|---|
| Data = Deployment | Data changes deserve the same validation rigor as code changes |
| Emergent corruption | Final output must be validated, not just individual inputs |
| Real traffic required | Shadow traffic can't simulate the full playback lifecycle |
| Blast radius control | Use ~0.2% of traffic — enough signal, minimal customer impact |
| Right metric matters | SPS (behavioral) beats latency/errors (technical) for data issues |
| Speed over statistics | Real-time abort beats post-hoc analysis when time is critical |
| Sticky sessions | Session affinity ensures clean baseline vs. canary comparison |
| Operational edge cases | Handle restarts, leader election, and version sync explicitly |
Final Thought
The Netflix Data Canary represents a shift in mindset: treating data pipelines with the same engineering discipline as software deployments. The next time you encounter a system where data changes frequently and impacts customers directly, the question isn't whether you need a data canary — it's how fast yours can detect a problem.