Step-by-Step Teaching
Step 1: Understanding the Core Problem
Why Do Agents Struggle With Charts?
Imagine you have a massive library of enterprise documents — financial reports, research papers, pharmaceutical studies. Much of the critical data lives inside charts and figures, not in plain text.
Traditional retrieval systems work like this:
User Question → Search Text Index → Return Relevant Pages → Generate Answer
The problem has two layers:
| Layer | Problem | Consequence |
|---|---|---|
| Retrieval | Text search cannot "see" chart values | Wrong pages returned |
| Answering | Agent only gets an image or vague caption | Cannot count/read precise values |
Concrete Example
Question: "How many local maxima are on this chart?"
| Approach | Method | Time Spent | Answer |
|---|---|---|---|
| Frontier Agent | Analyzed raw image | 50 seconds | 17 ❌ |
| Databricks Genie | Used structured JSON extraction | Fast | 18 ✅ |
Key insight: The image alone is ambiguous. Structured data is precise.
Step 2: The Proposed Solution — Structured Chart JSON
What Is Structured Chart Extraction?
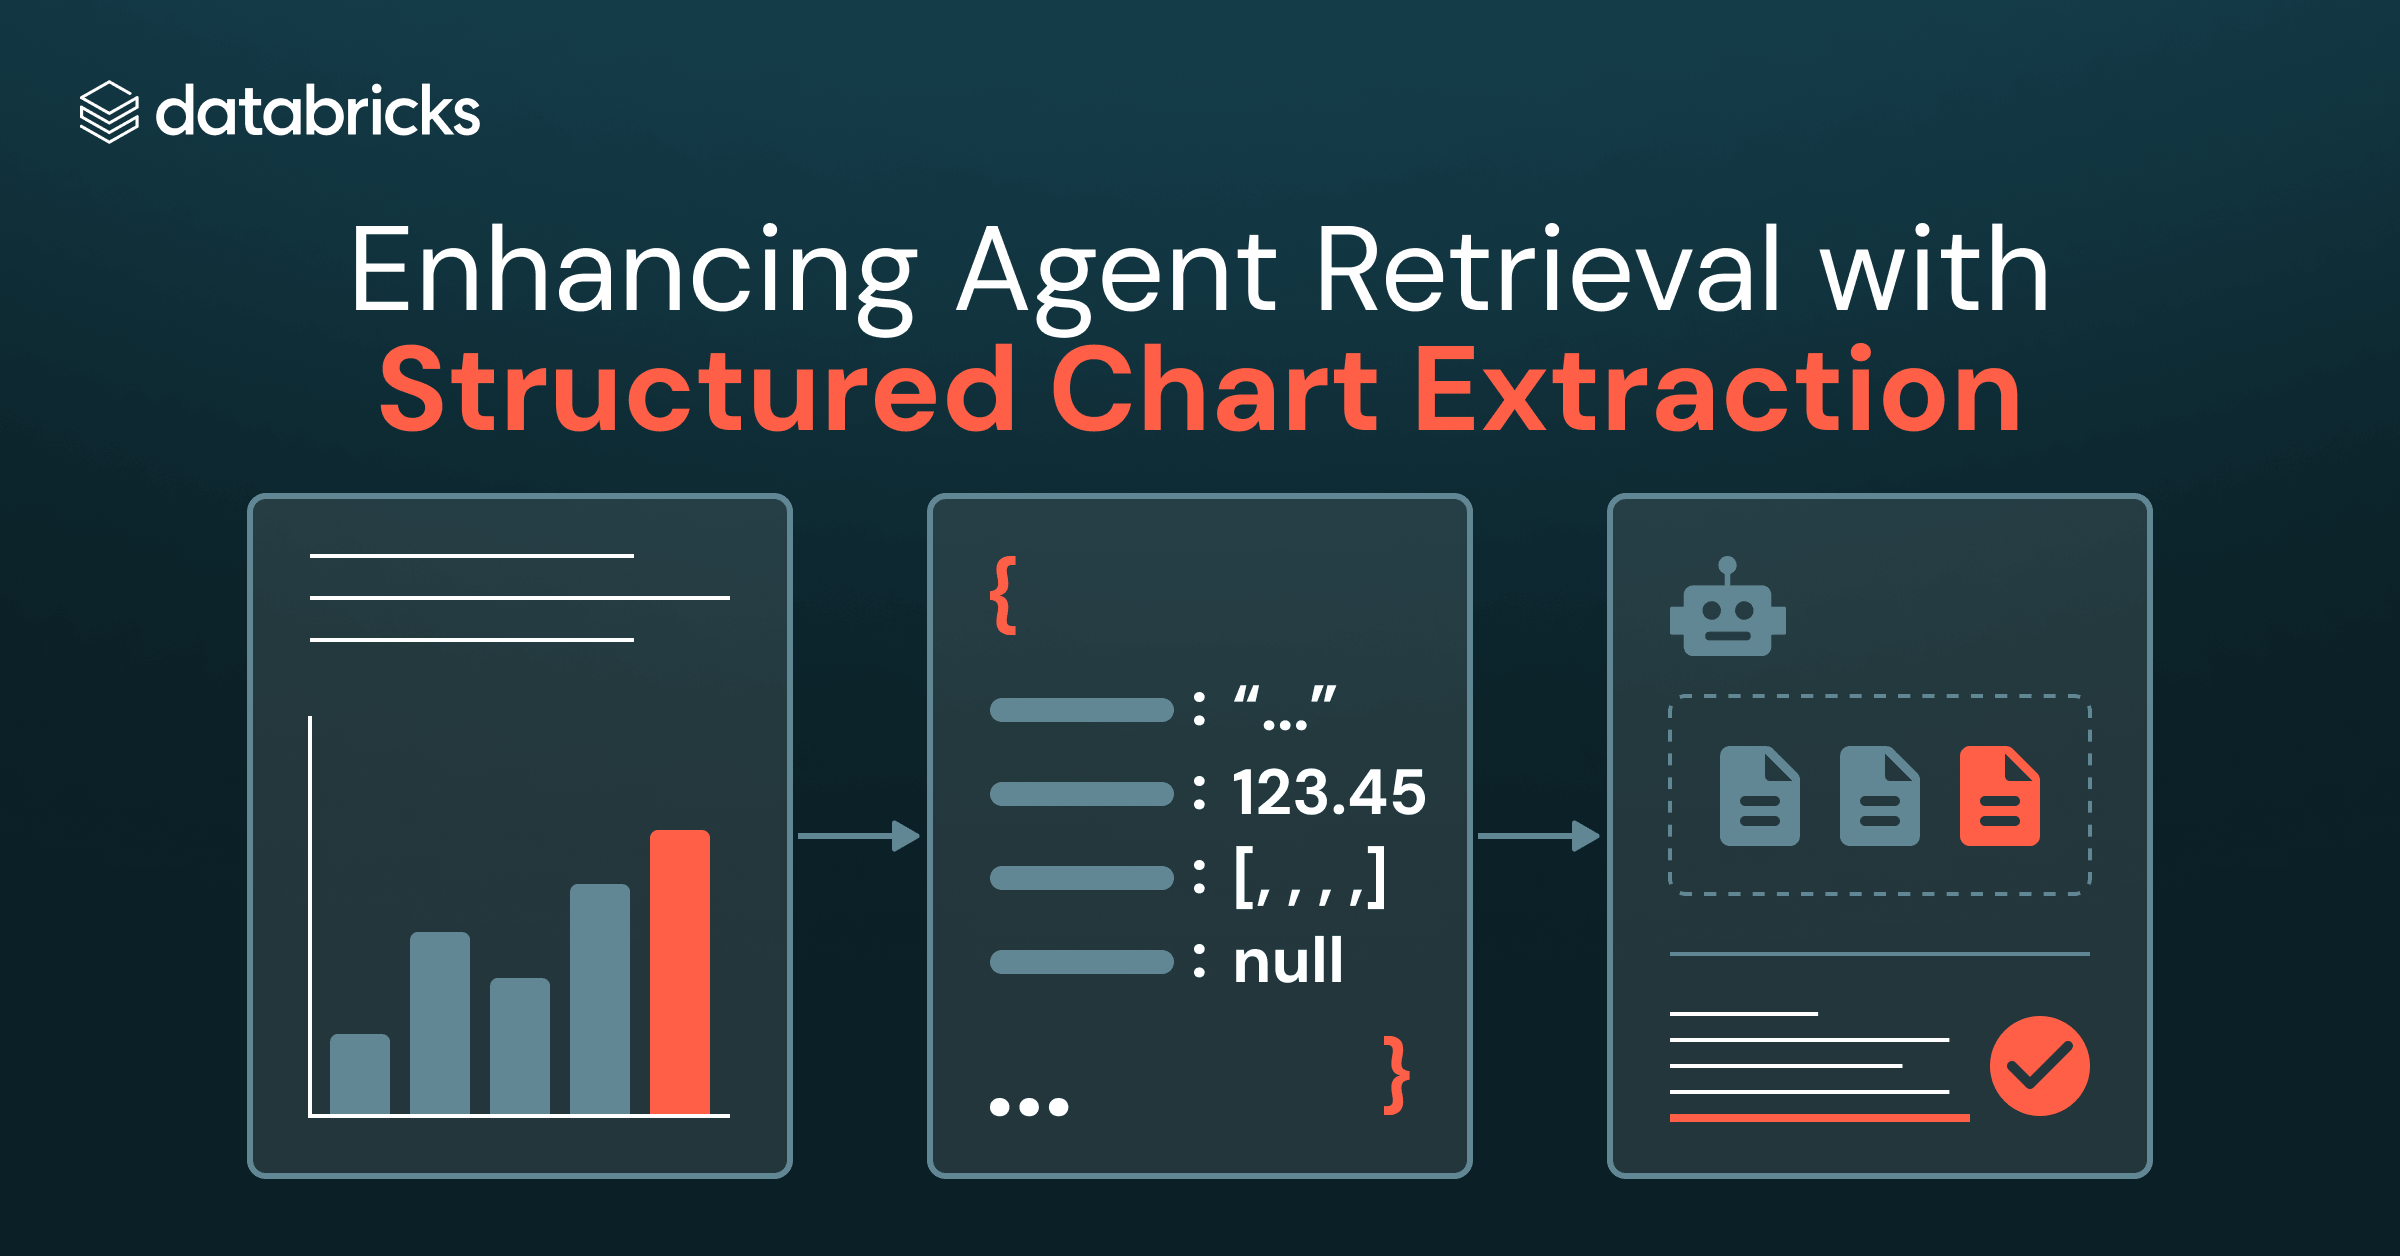
Instead of treating a chart as just an image, ai_parse_document converts it into structured JSON — a machine-readable format containing:
- Axis labels and values
- Data series names
- Numerical data points
- Chart type metadata
Visual Analogy
BEFORE (Image Only):          AFTER (Structured JSON):
┌─────────────────┐           {
│  📊 [chart img] │    →        "type": "line_chart",
│                 │             "x_axis": ["Q1","Q2","Q3"],
│  (opaque blob)  │             "series": [
└─────────────────┘               {"name": "Oil VIX",
                                   "values": [45, 62, 80]}
                                ]
                              }
Why This Helps Retrieval
When chart values become text in the index, the search engine can now match:
- A question about "Oil VIX peak" → finds the page containing "80" and "Oil VIX"
- Without JSON: the chart image is invisible to text search
Step 3: The End-to-End Pipeline
Architecture Overview
PDF Documents
     │
     ▼
ai_parse_document ──→ Extracts text + Chart JSON
     │
     ▼
ai_prep_search ──────→ Chunks content into retrieval-ready pieces
     │
     ▼
ai_search (BGE 300M text embedder) ──→ Builds searchable index
     │
     ▼
User Query ──→ Retrieve top chunks ──→ (Optional: add images) ──→ Generate Answer
Key Components Explained
| Component | Role | Size/Cost |
|---|---|---|
ai_parse_document | Extracts structured chart JSON | Preprocessing step |
ai_prep_search | Chunks and prepares content | Lightweight |
| BGE Text Embedder | Creates searchable vectors | 300M parameters (small) |
ai_search | Retrieves relevant chunks | Fast at query time |
Step 4: Evaluating the Approach
Two Benchmarks Used
Benchmark 1: ViDoRe V3 Subset
- 310 chart/infographic-heavy questions
- 16,000-page English corpus
- 7 domains: finance, energy, pharma, physics, etc.
Benchmark 2: Chart-RAG (Synthetic)
- 114 visually grounded questions
- 378 pages from 3 complex financial reports
- Purely chart-dependent questions (no text workarounds)
How Results Were Measured
Retrieval Quality:
├── Hit Rate@10 → Did the correct page appear in top 10 results?
└── nDCG@10    → Were the most relevant pages ranked highest?

Answer Quality:
└── LLM Judge scores each answer as:
    ✅ Correct / ⚠️ Partially Correct / ❌ Incorrect
Step 5: Results — What the Data Shows
Answer Quality Improvement (Example)
| Question | Without Chart JSON | With Chart JSON |
|---|---|---|
| "What peak level did Oil VIX reach in Q1 2026?" | "I cannot find specific information..." ❌ | "Approximately 80 percentage points" ✅ |
Adding Images on Top of JSON
After retrieving text chunks with JSON, optionally passing the top 3 page images to the agent adds further gains:
Text + JSON only:     baseline
+ Top 3 images:       +4.0 pp on Chart-RAG
                      +2.6 pp on ViDoRe V3
Why? Some questions depend on visual appearance (colors, shapes, layout), not just numerical values.
Step 6: Comparison Against Multimodal Models
The Competition
| Model | Type | Parameters | Approach |
|---|---|---|---|
| This approach | Text + JSON | ~300M | Structured extraction |
| ColQwen2.5-3B | Multi-vector multimodal | 3B | Late-interaction scoring |
| Qwen3-VL-Embedding-2B | Single-vector multimodal | 2B | Cosine similarity |
| Jina CLIP v2 | Single-vector multimodal | 0.9B | Cosine similarity |
| CLIP ViT-L/14 | Single-vector multimodal | 428M | Cosine similarity |
Final Scorecard
| Dataset | This Approach (JSON + 3 images) | Best Multimodal Baseline |
|---|---|---|
| ViDoRe V3 | 75.9% correct | Lower |
| Chart-RAG | 75.1% correct | Lower |
The Efficiency Advantage
ColQwen2.5-3B:          3,000M parameters + complex late-interaction
This approach:            300M parameters + simple text search
                         ─────────────────────────────────────────
Difference:              ~10x smaller, simpler, yet MORE accurate
Step 7: Key Takeaways — Synthesizing the Concepts
Mental Model Summary
PROBLEM:  Charts are invisible to text search → wrong retrieval → wrong answers

SOLUTION: Convert charts to structured JSON → text search can find chart data
          → correct retrieval → correct answers

BONUS:    Add top retrieved page images at answer time for visual questions

RESULT:   Outperforms models 10x larger with less complexity
Three Core Principles to Remember
-
Structured > Visual for Retrieval
- JSON values are searchable; raw images are not
- Precise numbers beat vague captions
-
Retrieval Quality Drives Answer Quality
- If the wrong page is retrieved, even a perfect LLM fails
- Better retrieval = better answers (shown empirically)
-
Efficiency Matters
- A 300M text model + good preprocessing beats 3B multimodal models
- Simpler architecture = lower cost, faster indexing, easier maintenance
Quick Self-Check Questions
Test your understanding:
- Why does a text-only retrieval system fail on chart questions?
- What does
ai_parse_documentproduce that makes charts searchable? - When would adding images at answer time help beyond JSON alone?
- How does this 300M-parameter approach compare to a 3B multimodal model in accuracy?
- What are the two metrics used to evaluate retrieval quality?
Answers: (1) Charts are images — text search can't read pixel values. (2) Structured JSON with axis labels and data values. (3) When questions depend on visual appearance, not just numbers. (4) It outperforms it while being ~10x smaller. (5) Hit Rate@10 and nDCG@10.